Overview of Bihar Flood
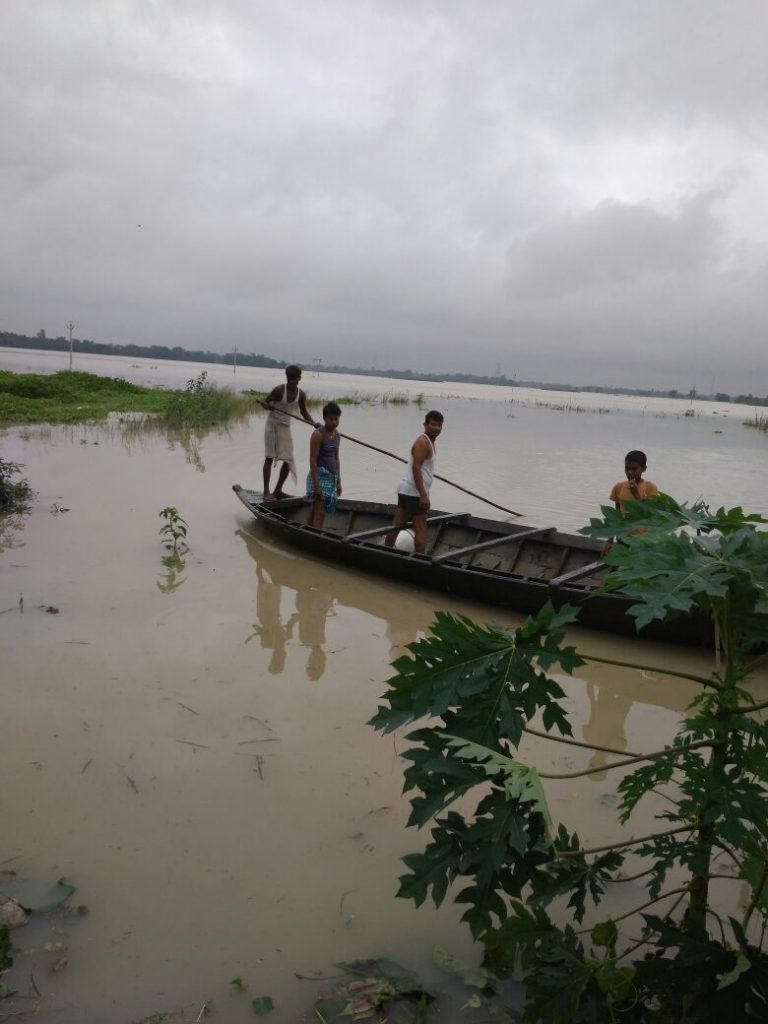
This year, 18 out of the 38 districts of Bihar are heavily devastated by flood. Approximately 12.6 million people in 1,965 panchayats of 171 blocks in the state are impacted. Total loss of human life due to the flood reached 253 (Times of India report, dated 21/08/17). Crop and livestock loss due to flood is yet to be estimated but predictions are quite high. The unprecedented rain amounting to 525mm in eastern Nepal together with 250mm rainfall in the border districts of the Bihar over three days caused devastating floods in the bordering districts.
Water stagnation on village roads near Jhanjharpur
Flood Situation in Madhubani
The District Magistrate of Madhubani said about 5 lakh people of 15 blocks of the district have been affected. Total 13 flood related deaths have been reported in the district. While the actual rainfall for the season (942 mm) was not significantly higher than the average rainfall (846 mm) of same period, the rainfall intensity and rising river water has added to flooding and ponding.
Croplands inundated with flood water along National Highway 57
Flood affect our project village
Our project village Bhagwatipur is worst affected by flood. No loss of life from the villages is reported so far. In Bhagwatipur village almost entire paddy crop washed away by flood except few patches of elevated uplands. Our transplanted paddy crops at the intervention sites 2, 3 and 4 from Bhagwatipur are completely washed away and the level of damage is very severe. There is no crop loss from intervention site 1 of Bhagwatipur. In Mauahi, floods have caused severe damage to some crops such that the crops is completely washed away.. If the rainfall continues, the situation is likely to get worse. During the flood events there was standing water of about 3-3.5 feet, and at present, standing water has receded from experimental fields, and it may take about 2-3 weeks to make the soil workable.
Fig 1. Cumulative rainfall at Bhagwatipur plotted against the 50 year wet and dry years and the average rainfall
Fig. 2 Comparison of monthly average and actual rainfall at Bhagwatipur
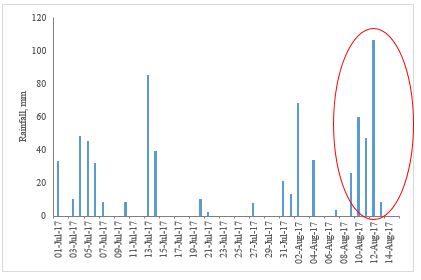
Fig 3. Daily rainfall from 1st July at Bhagwatipur (circled the flood triggering events)


